

Excel Isn't the Only Way to Understand Your Model
Data isn't just about looking tables

Which part of the model uses the most steel? Which members are actually failing? How is this version different from the last one? Which asset belongs to who ?
These are questions people ask about their models all the time. The problem is, your program won’t answer them. They’re too specific to your project. So you export the data, open Excel, and write a bunch of formulas to figure it out.
But then what? Once you have an answer, relating it back to your 3D model is a pain. You’re staring at a row in a spreadsheet thinking “okay, but where is that in the model?” There are just so much data that it’s really easy to get lost.
That’s where Grasshopper comes in. And honestly, this is one of the best things about it. You can build your own query on the data and then display the result alongside or on top of your 3D model. It lets you ask specific questions about your model and view the answer back in 3D.

It’s a simple concept, but it’s an excellent way to communicate. A table tells a good story but a coloured model with a legend is clearer and way more compelling. No one has to do the mental gymnastics of relating a number on a spreadsheet back to a portion of the model.
Most of the time, data and models live in separate worlds. With Grasshopper though, you can intersect the two in your unique way. You can pull geometry and data from the model, process it relating to your question and then display it back in 3D. That’s not something many programs can do, unless you’re connecting an LLM to your model, which is a whole different rabbit hole.
Here are a few examples where this approach has paid off for me:
Finding Differences
Even just putting a title on your view can help communicate what you’re looking at. Especially if you have a script that displays multiple results and you need to loop through them.
Here, my script finds the differences between floor outlines for each level and puts the floor name on the view. As I loop through each floor, the title makes it obvious which one we’re seeing.
Showing Measurements
Then there’s what you saw before. A way to show a “measurement” on a model. Things like volume, area, or even custom stuff like embodied carbon. The idea is to show how a property relates back to the 3D model. You use colours to clarify the measurement in the model itself.
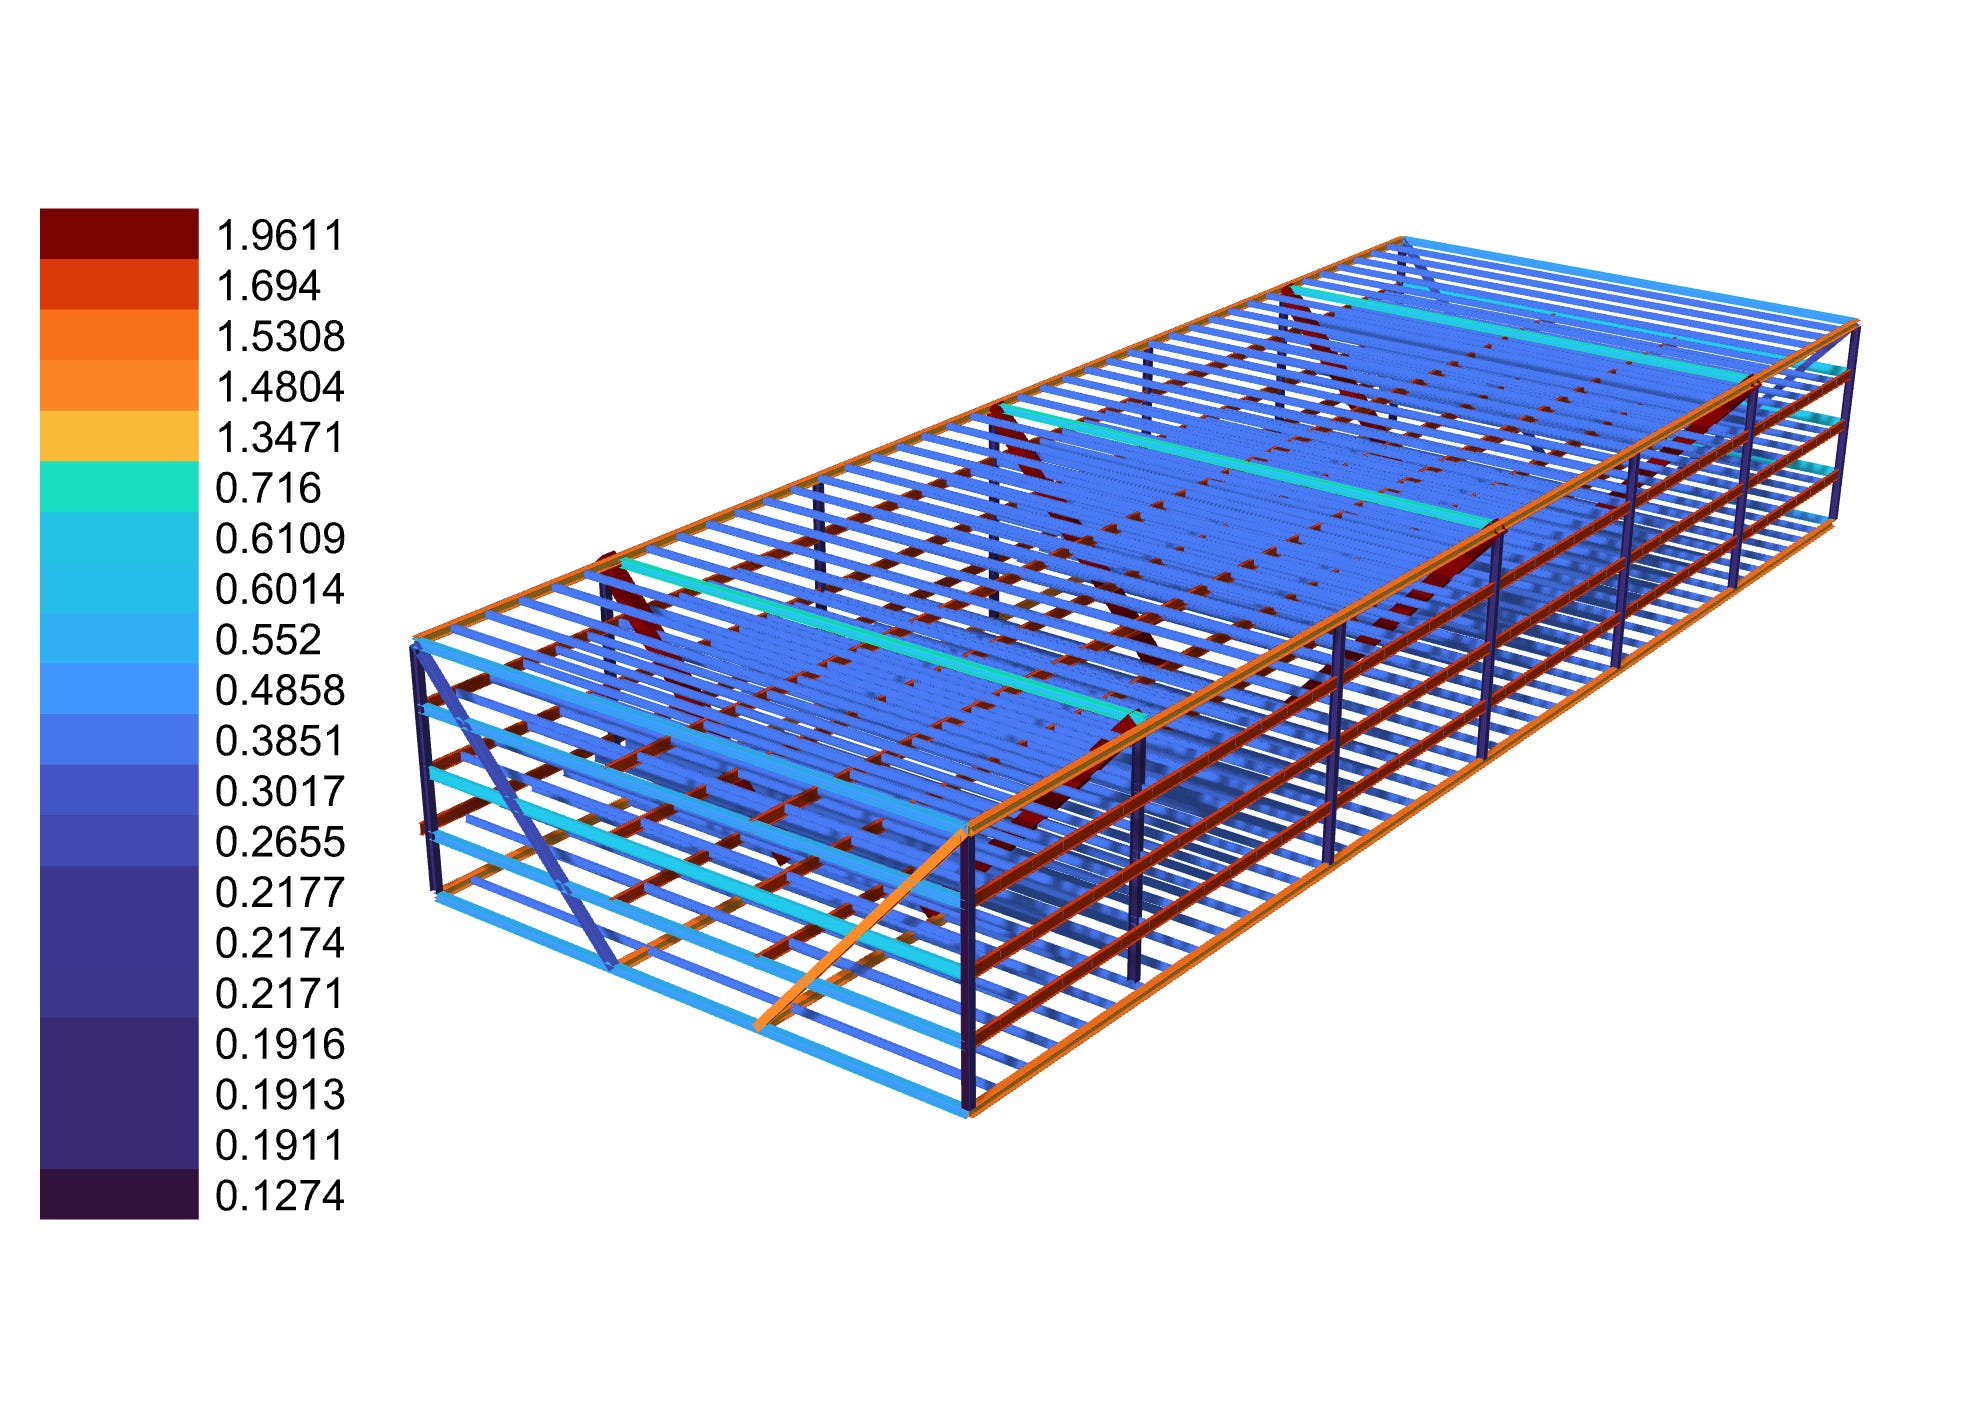
This tells you which part of the model actually takes up the most volume or carbon or whatever measurement you’re after. It’s great for visualising how a property is distributed across your model. You can do this to see tonnages, asset data, results, and more. You can view and colour your model by any metadata you can think of.
Displaying Custom Results
Most programs have a lot of data, and sometimes you want to apply your own rules to it. Like post-processing analysis results or taking a model’s tonnage and cross referencing it with different databases to get back accurate carbon emissions.
You can export to Excel and use formulas or python, but again, there’s no good way to relate that back to the model. With Grasshopper, you can apply any custom formula or rule and, because you have the geometry, you can then display the results in 3D too.
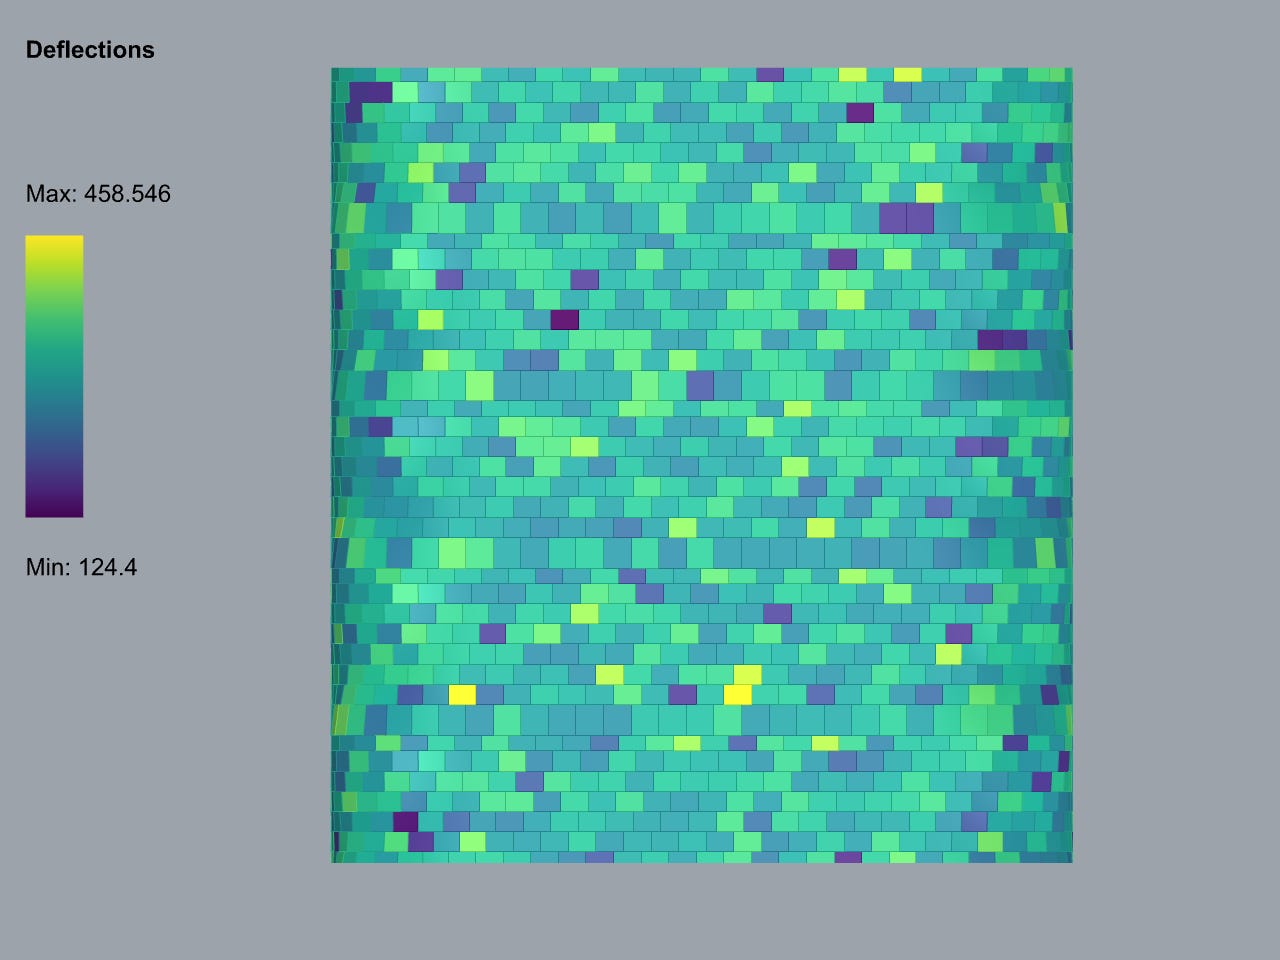
This means you’re not just visualising data. You’re processing it in your own way and displaying it in your own way. It just gives you more control over how you see those numbers.
How Do I Set This Up?
The way I do this is through using custom material preview and creating a custom HUD (Heads-Up Display) in Grasshopper. I won’t pretend it’s simple to set up. You need to understand how the components work, how to map values to colours, and where to place things on screen.
But you only have to figure it out once. After that, it’s reusable. Each time you want to display something new, you just plug it in.
Next week, I’ll walk you through exactly how I built mine. The components, the logic, and how to make it your own. If you’ve ever wanted to visualise your data inside your models, this is a good a way to do it.
See you then.
Braden
Want to learn where to apply computational design?
Subscribe to CodedShapes and I’ll send you my free guide on how to actually do that